Distinguishing Characteristics
Thought Process
We invest behind key growth inflection points in a company’s fundamentals as we assert the market is slow to appreciate the magnitude of meaningful change.
Diverse Growth Universe
We take an expansive and differentiated view of growth that allows us to invest in multiple types of growth stocks at various stages of their lifecycle.
Time Horizon
Our investment process emphasizes a company’s long-term growth potential over shorter-term trends.
The Way We Think
We believe that accelerating growth in revenue and earnings is associated with identifiable factors that produce excess returns to stock prices over the long term. We assert that opportunities that exist in informationally inefficient markets can be amplified by identifying and exploiting key inflection points in a company’s fundamentals.
We Believe In:
Collaboration
Our team culture is conducive to generating long-term sustainable alpha. We work together in a close, non-hierarchical fashion. Team members are empowered by intellectual inclusion.
Behavioural Inefficiencies
International equities are a structurally inefficient asset class and our investment process is structured to identify and exploit those inefficiencies for the benefit of our clients.
Liquidity
International equities are a structurally inefficient asset class and our investment process is structured to identify and exploit those inefficiencies for the benefit of our clients.
Risk Management
Differentiated risk management is an important part of the overall investment DNA of Virelle and we leverage comprehensive risk management toolsets to support our processes.
Process and Portfolio Construction
For both our International Equity strategy and our International Small Cap strategy, we construct a diversified portfolio of 65-85 global growth stocks where idiosyncratic and industry change can produce some of the largest and most sustainable inflection points.
Develop Investment Thesis
Assess Financials
- Review historical financial statements and company reports
- Read all available company- specific information
- Determine relative strength and growth prospects
Evaluate Growth Drivers
- Assess quality of earnings
- Target drivers of acceleration
- Multiple meetings with company management
Quantity Growth Trends
- Conduct scenario analysis - bear/base/bull cases
- Assess relative valuations
- Evaluate consensus expectations
Verify Potential
- Leverage non-traditional sources of information
- Conduct channel checks, attend industry trade shows and engage customers and suppliers
Investment Strategy
We conduct extensive primary research, make use of a collaborative culture, and overlay time-tested behavioural finance anomalies to invest on behalf of our clients. Let us show you what we can do in one of the most inefficient style boxes on the planet.
We have a flexible and holistic definition of growth stocks at various points in their life cycle.
We have a differentiated view of risk on a global basis and relative to other growth stock styles.
We optimize the intersection of information and behavioral inefficiencies on a global scale.
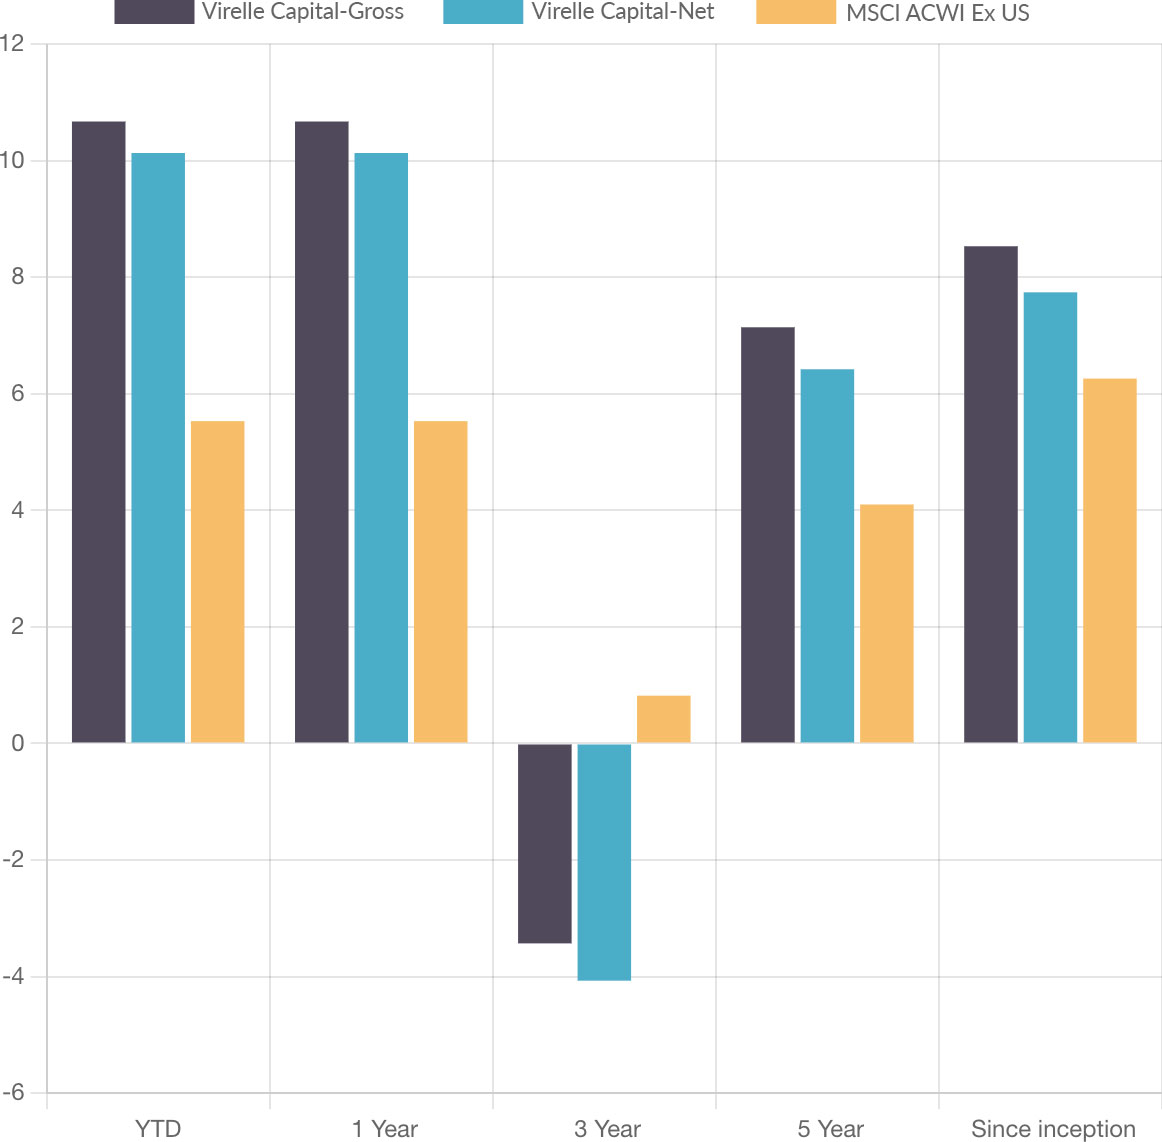
International Equity
- Strategy: Virelle Capital International Equity
- Index: MSCI ACWI Ex US
- Available Vehicles: Separately Managed Account, Collective Trust
- Inception Date: March 31, 2016
Composite Performance as of December 31, 2024*
MSCI (“MSCI”) is the source and owner of the trademarks, service marks and copyrights related to the MSCI Indexes. MSCI® is a trademark of MSCI. Neither MSCI nor its licensors accept any liability for any errors or omissions in the MSCI Indexes and/or MSCI ratings or underlying data and no party may rely on any MSCI Indexes and/or MSCI ratings and/or underlying data contained in this communication. No further distribution of MSCI Data is permitted without MSCI’s express written consent. MSCI does not promote, sponsor or endorse the content of this communication.
The MSCI ACWI ex US Index captures large and mid cap representation across 22 of 23 Developed Markets (DM) countries (excluding the US) and 24 Emerging Markets (EM) countries*. With 2,156 constituents, the index covers approximately 85% of the global opportunity set outside the US.
Composite Performance reflects reinvestment of all income and capital gains and is shown in US dollars and after the deduction of transaction costs. Composite Performance is shown gross and net of actual management fees charged. Actual investment advisory fees incurred by clients may vary. Additional information on the calculation methodologies used herein is available upon request. Indexes are unmanaged, do not incur management fees and cannot be invested in directly. The Composite and index returns are net of any foreign withholding taxes on dividends, interest, and capital gains.
Past performance is not indicative of future results. Performance during certain periods reflect strong stock market performance that is not typical and may not be repeated.
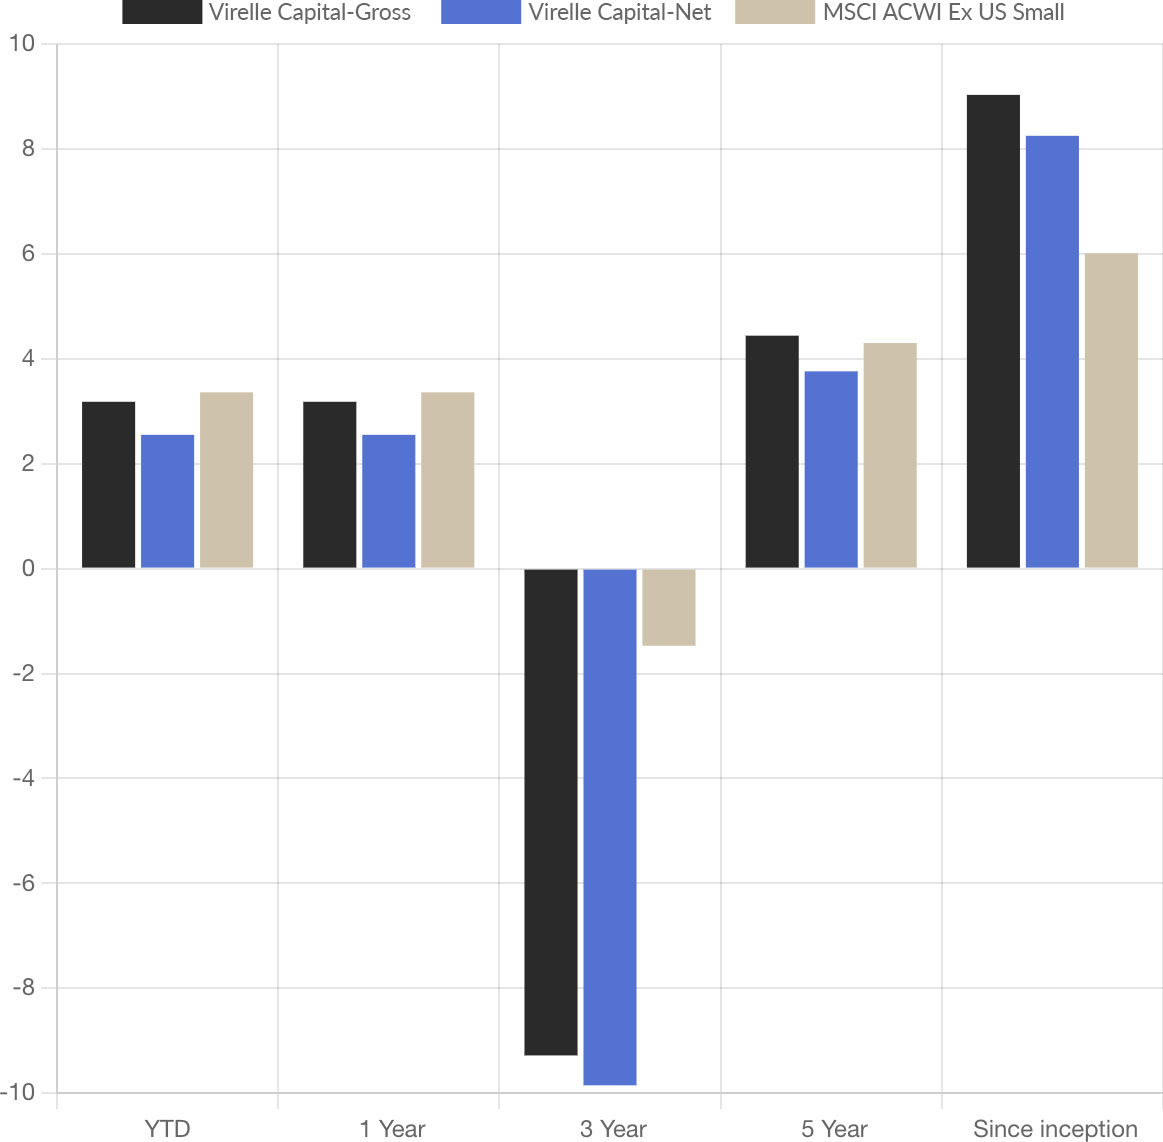
International Small Cap
- Strategy: Virelle Capital International Small Cap Equity
- Index: MSCI ACWI Ex US Small Cap
- Available Vehicles: Separately Managed Account, Collective Trust
- Inception Date: December 31, 2015
Composite Performance as of December 31, 2024*
MSCI (“MSCI”) is the source and owner of the trademarks, service marks and copyrights related to the MSCI Indexes. MSCI® is a trademark of MSCI. Neither MSCI nor its licensors accept any liability for any errors or omissions in the MSCI Indexes and/or MSCI ratings or underlying data and no party may rely on any MSCI Indexes and/or MSCI ratings and/or underlying data contained in this communication. No further distribution of MSCI Data is permitted without MSCI’s express written consent. MSCI does not promote, sponsor or endorse the content of this communication.
The MSCI ACWI ex US Small Cap Index captures small cap representation across 22 of 23 Developed Markets (DM) countries (excluding the US) and 23 Emerging Markets (EM) countries*. With 4,273 constituents, the index covers approximately 14% of the global equity opportunity set outside the US.
Composite Performance reflects reinvestment of all income and capital gains and is shown in US dollars and after the deduction of transaction costs. Composite Performance is shown gross and net of actual management fees charged. Actual investment advisory fees incurred by clients may vary. Additional information on the calculation methodologies used herein is available upon request. Indexes are unmanaged, do not incur management fees and cannot be invested in directly. The Composite and index returns are net of any foreign withholding taxes on dividends, interest, and capital gains.
Past performance is not indicative of future results. Performance during certain periods reflect strong stock market performance that is not typical and may not be repeated.